Report catalogue
Saved reports are defined, run and shared.
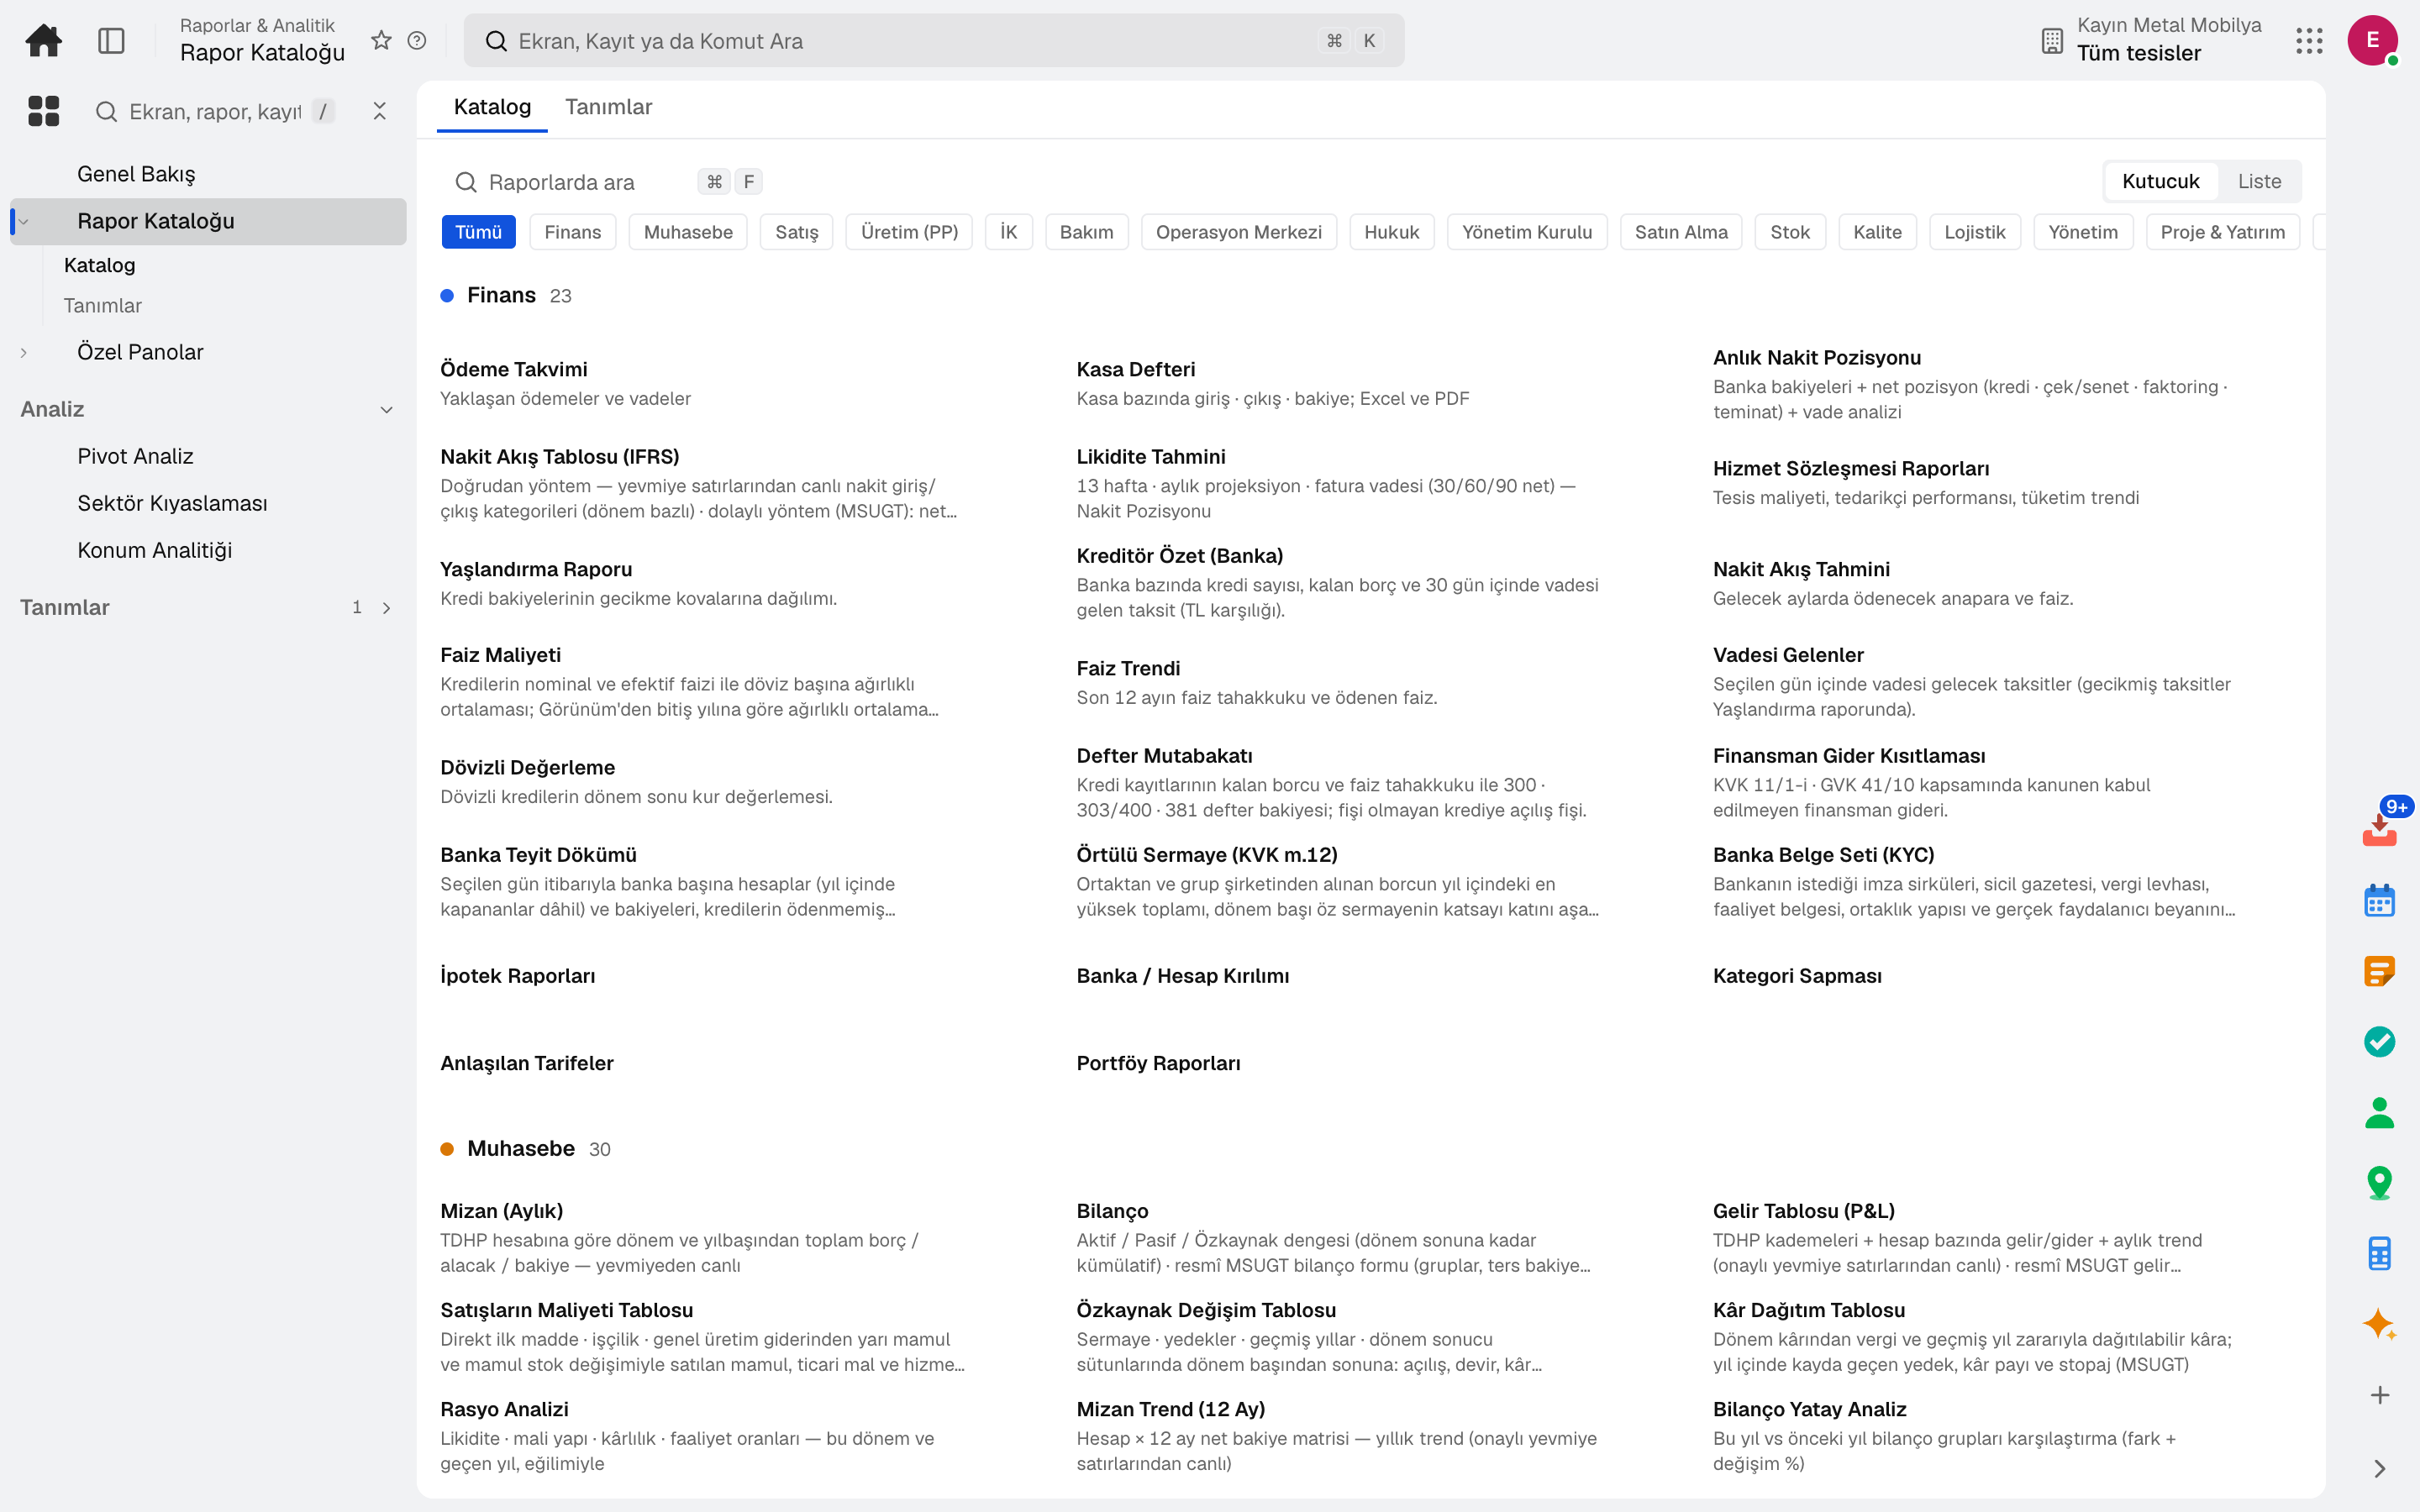
Report catalogue, pivot analysis, custom dashboards, process mining and location analytics. Because data comes from every app in the same model, figures do not differ between reports.
Roles: General manager and board · Finance manager
What is it, and why do you need it?
When each department pulls its own report from its own data, management meetings turn into arguments about numbers; updating one report takes a specialist a whole day.
Analytics reads the data of every app from a single model. Saved reports are shared, pivot analysis runs in the browser, and process mining finds the bottleneck from transaction logs.
Scope: Visualises cross-module data with reports, dashboards and analyses.
Highlights
Saved reports are defined, run and shared.
Live OLAP queries on the data, in the browser.
Design your own dashboards from metrics and charts.
The process flow is derived from transaction logs and bottlenecks are analysed.
Data is analysed by location on a map.
Every app's overview dashboard comes with its own indicators; the numbers are calculated on the server.
The company's ratio, percentage and day indicators are compared with the anonymous distribution of participating companies: industry median, quartiles and the company's position.
A budget, targets or an export from another system is uploaded as CSV or Excel; the data set becomes a report source and is grouped in the same report as ERP data.
Saved reports are defined, run and shared in the catalogue.
Sub-modules
This list is generated from the product itself; it grows as new functions are added to a sub-module. Master data and settings are the shared ground of every module and are not counted as sub-modules.
On the same data
Modules are separate screens, but the data is one: a record entered in one module is never re-entered in another.
In the journal the moment the invoice is issued; no waiting for month end.
One customer record from opportunity to invoice.
Users, permissions, definitions and integrations on one admin screen.
From order to batch, planned and produced side by side.
Frequently asked
Yes. Reports and lists are exported as Excel and CSV.
The report catalogue and custom dashboards hold the reports users build; the report studio in Financial Accounting builds the financial statements.
Data is transferred to external systems through a versioned API and webhooks.
Try it free for 15 days; no credit card needed. We reply to your questions within one business day.